
Weekly recap: 3/5/23
One day at a time.
Along with some highlights (and lowlights), I thought it would be best to display the chart below as visual of the week’s progression:
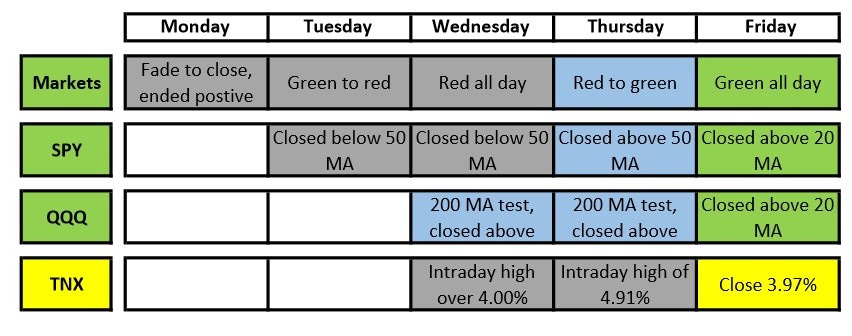
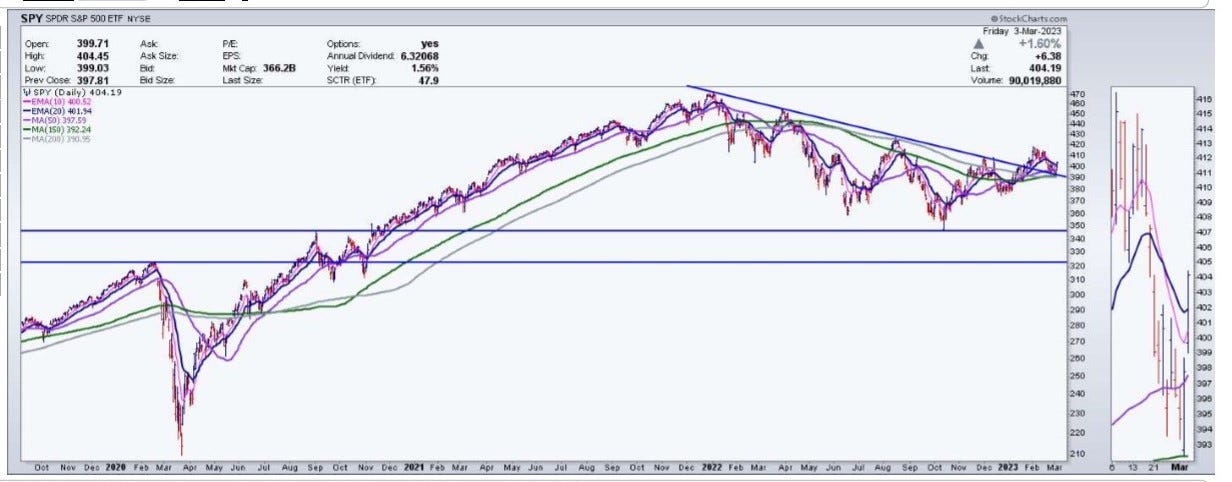
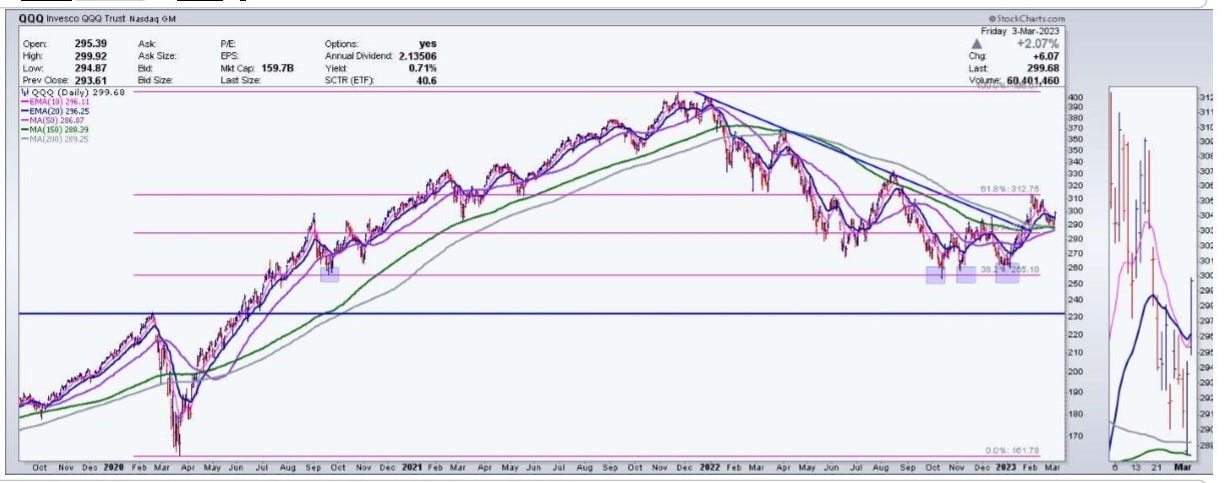
The good: The week was a sea of red until the “11th hour” on Thursday, when the bulls took charge, pushing price into the “green” by close and the SPY above its 50 MA. Follow through on Friday saw the SPY and QQQ both reclaim their 20 day MAs as the 10-year Treasury touched an intraday low of 3.92% and closed near the session’s lows.
The bad: The 10-year climbed to an intraday high of over 4% on Wednesday, the first time since November 2022. This date corresponds to the peak of the previous longer term uptrend and the unfortunate beginning of the subsequent 27% bear market decline that ended January 2023.
The ugly: Treasury yield ascent culminated with an intraday high of 4.91% on Thursday and ended Friday at 3.97%, only a couple of “ticks” away from the important 4% level.
Following a week of tumult, we now find ourselves back to where we started—price for both ETFs are above all MAs and their respective trend lines. We’ll see if the markets can build on the momentum from last week, or if the recent “kick save” is short-lived.
Weekly gain/loss
SPY +1.97%
QQQ +2.68%
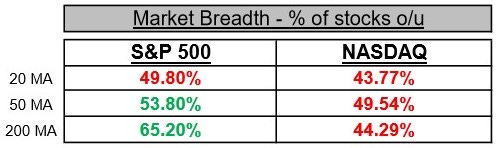
Market breadth
In an uptrend, you would see 50.00+% in every cell of the below chart.
S&P 500 continues to display relative strength over NASDAQ stocks from a longer term perspective as 50% of stocks are above the 50 and 200 MA. By comparison, the NASDAQ shows more than 50% of stocks below all three MAs shown.
Areas of strength
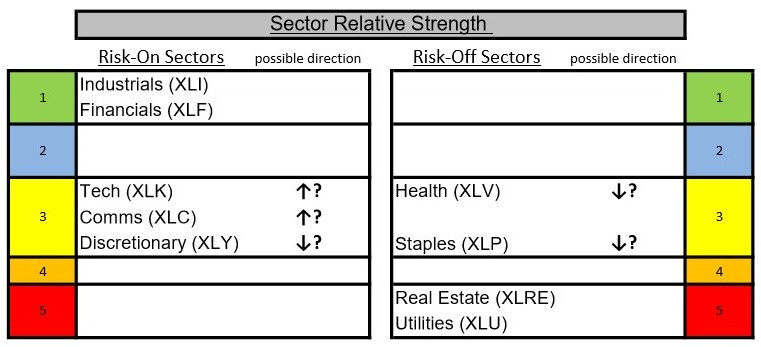
Sector Relative Strength: Drilling down further, I’ve created five tiers of sectors based on relative strength (1 being the strongest, 5 the weakest). When looking for stocks to enter, you’d like to see them in the top two tiers.
As mentioned in my 3/4/23 weekend scan, concentration amongst stock leaders continues primarily in the industrial, financial and technology sectors.
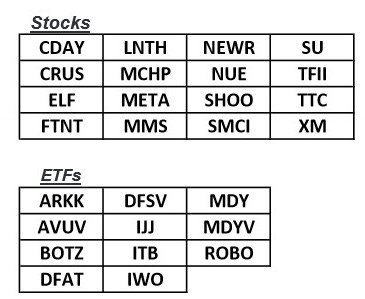
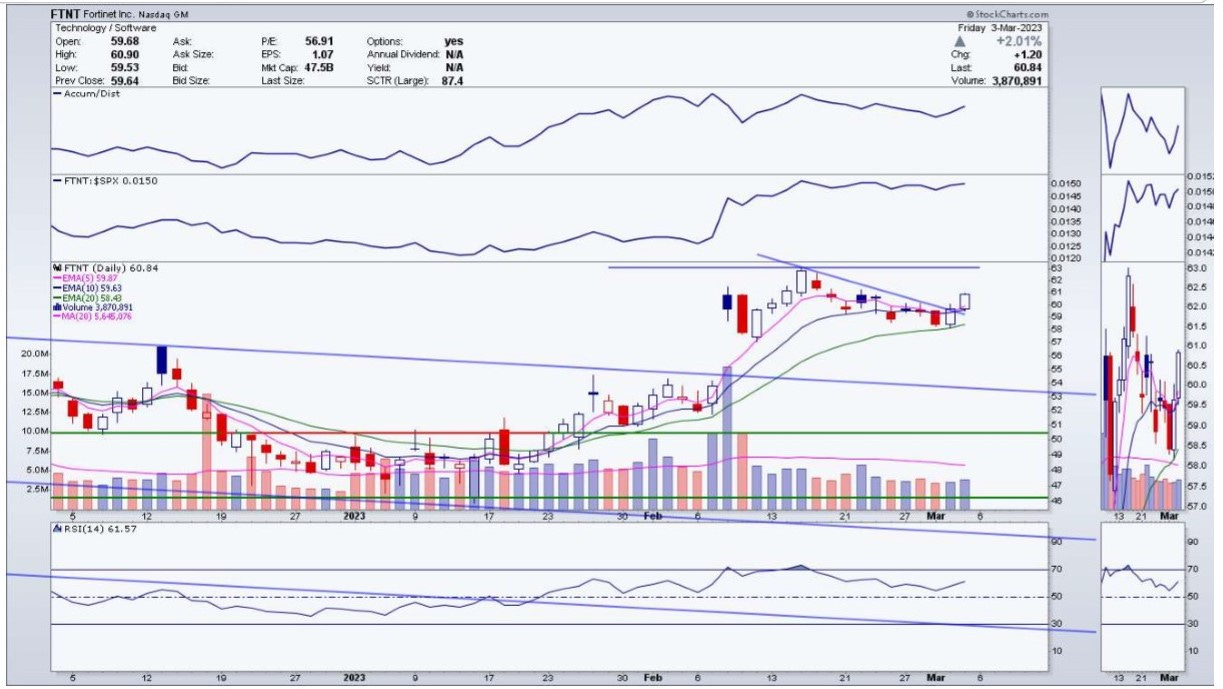
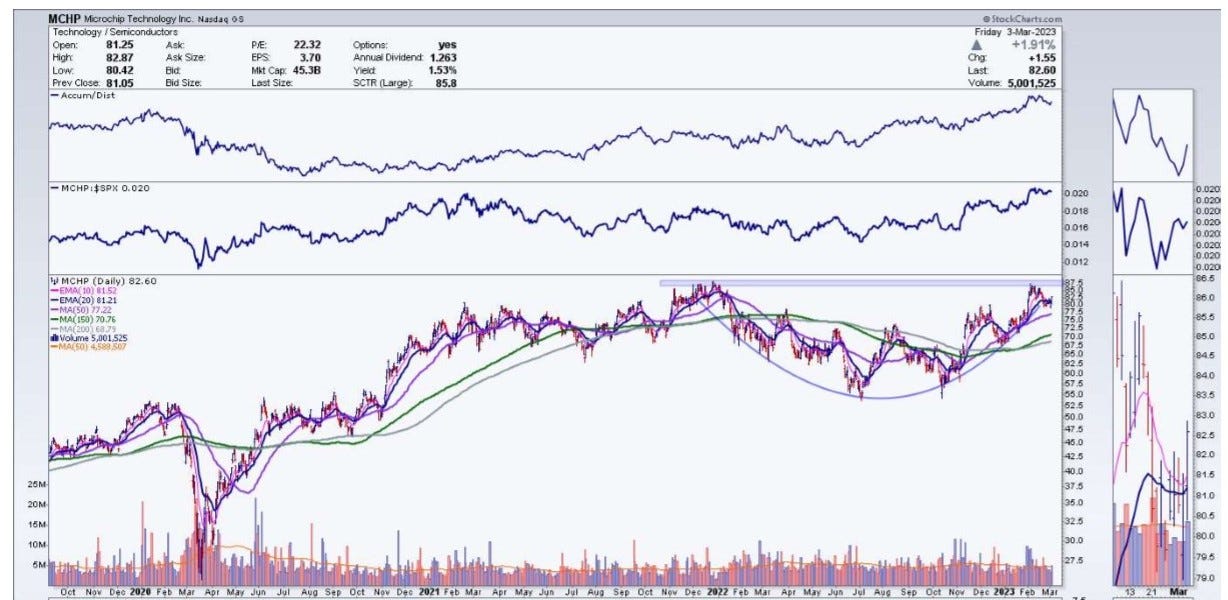
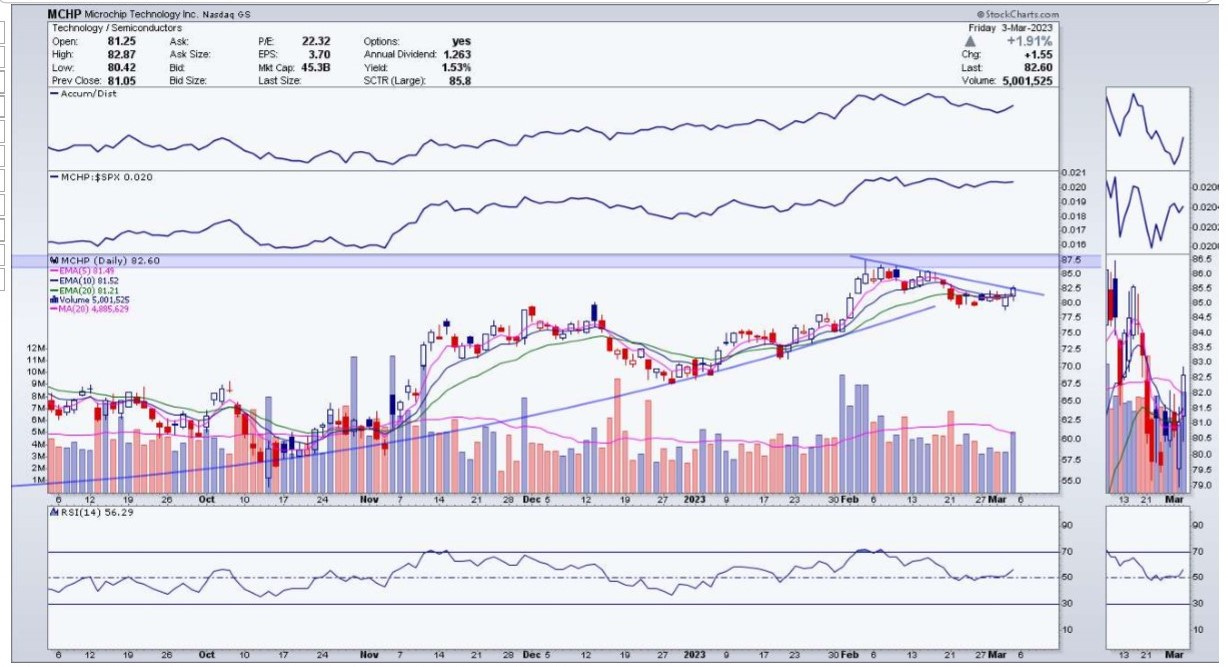
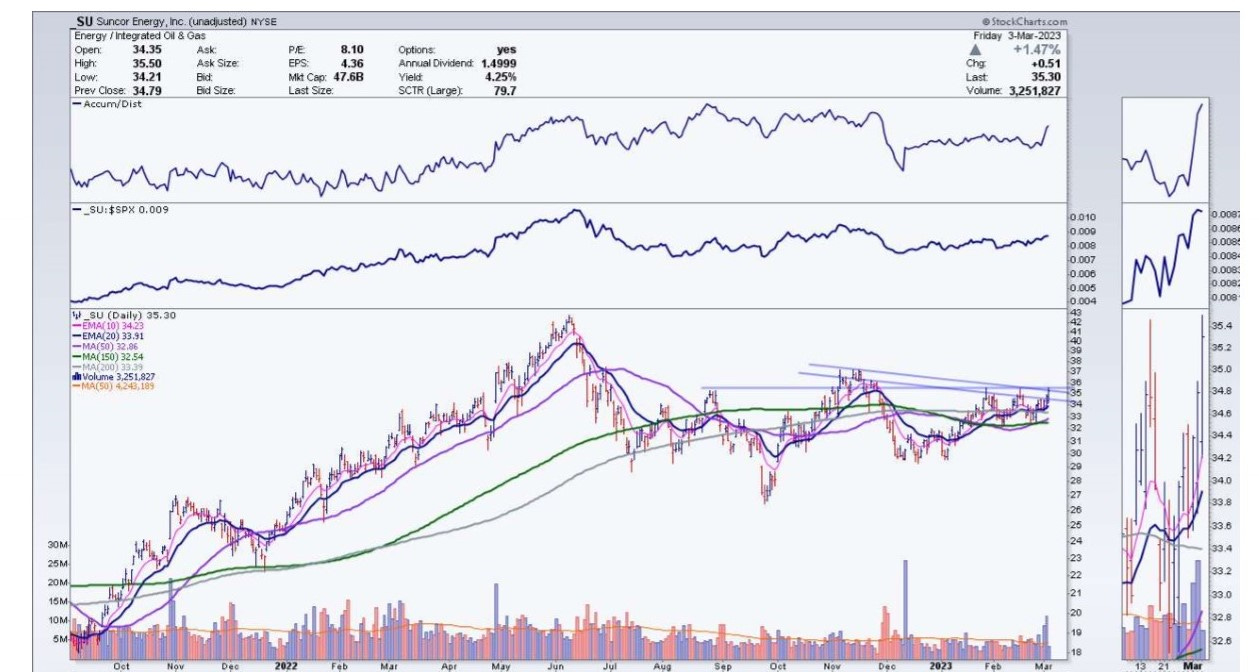
This week’s focus list
The below stocks and ETFs exhibit a positive technical picture along with relative strength. Alerts are set, as they are (at the moment) potentially actionable.
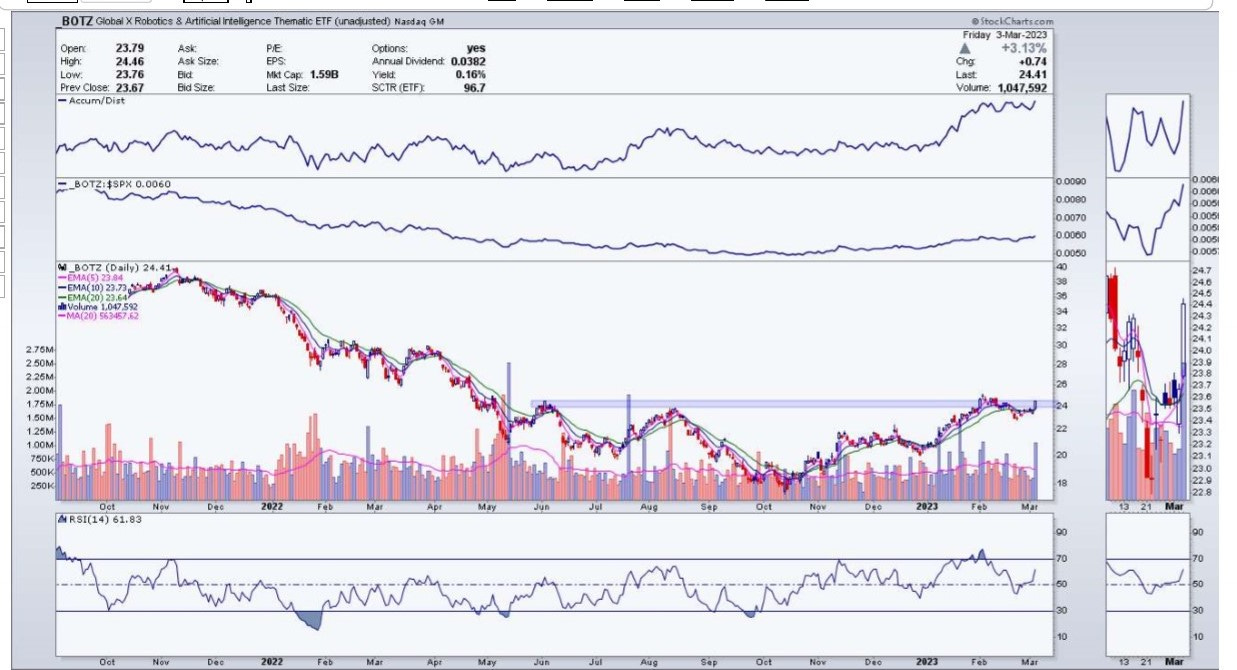
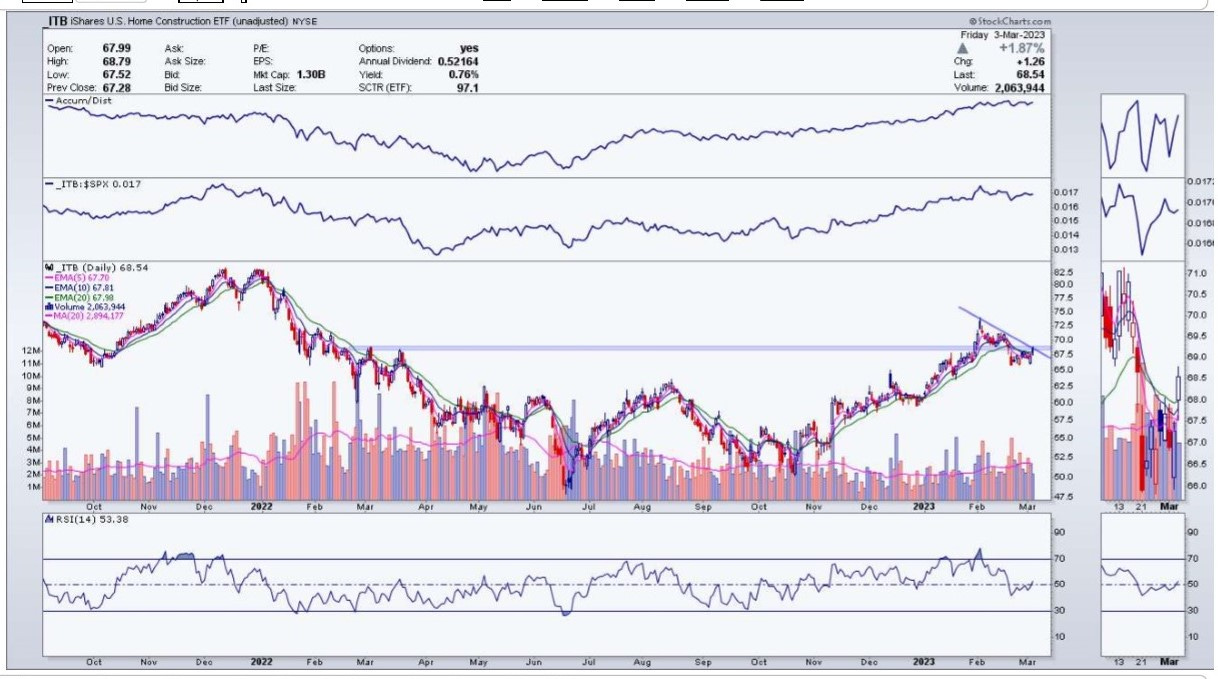
I have charts with annotations for all of the above, here are a few of my favorites heading into the week.

Each week represents an opportunity. Let’s use this one to learn, grow and be the best traders we can be.
Thoughts, questions, comments? Let’s talk about it!
Disclaimer: This information is for educational purposes only.